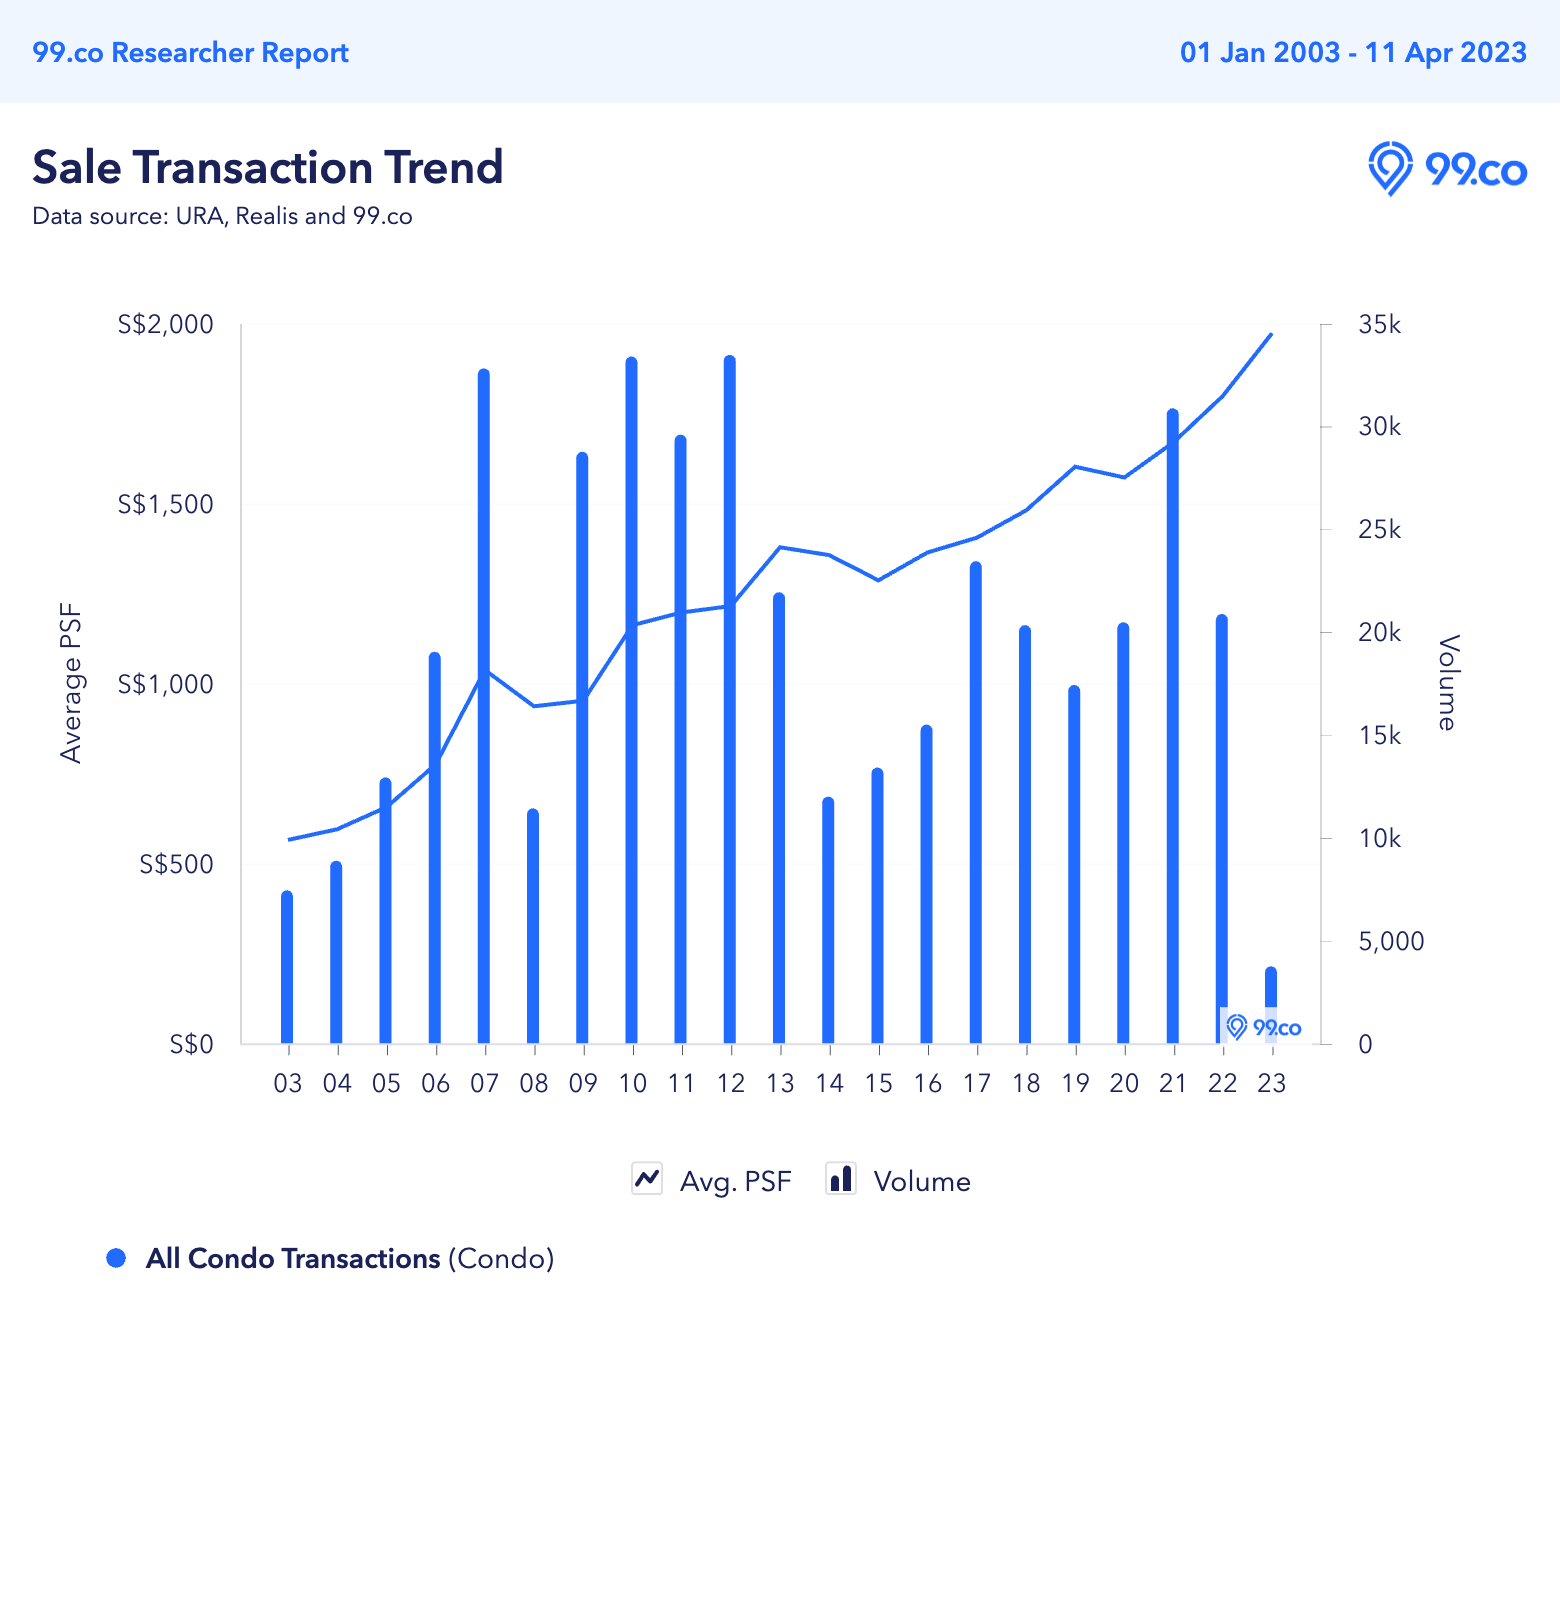
Home prices are at their peak in the last two years, with private residential property prices increasing by 3.2% in the first quarter of 2023.
This signifies a good time for owners to sell their properties, as they’re more likely to get higher capital gains.
Unfortunately, not every owner can realise a capital gain even when they sell their properties during a property boom.
Among the private residential property transactions recorded by URA (captured as of 11 April 2023), 99.co found 39 condo transactions that were loss-making in February 2023. At the same time, condo resale prices have increased by 1.4% in the same month, as noted in the 99-SRX Flash Report.
| Condo name | Size (sq ft) | Purchase price (S$) and date | Sale price (S$) and date | Capital gain (S$) | Capital gain (%) | Years held | Annualised loss |
| Paterson Suites | 4,845 | 14,532,000
1 Sep 2011 |
11,850,000
1 Feb 2023 |
-2,682,000 | -18.5% | 12 | -1.69% |
| CityVista Residences | 2,809 | 7,702,455
25 Jul 2007 |
5,688,800
21 Feb 2023 |
-2,013,655 | -26.1% | 16 | -1.88% |
| Marina Collection | 1,873 | 4,907,280
2 Jan 2008 |
3,300,000
21 Feb 2023 |
-1,607,280 | -32.8% | 15 | -2.61% |
| The Scotts Tower | 851 | 3,080,000
28 Sep 2012 |
1,770,000
24 Feb 2023 |
-1,310,000 | -42.5% | 11 | -4.91% |
| The Orchard Residences | 2,175 | 7,800,000
11 Feb 2010 |
6,700,000
27 Feb 2023 |
-1,100,000 | -14.1% | 13 | -1.16% |
| Helios Residences | 1,281 | 3,938,790
30 Jul 2007 |
3,080,000
2 Feb 2023 |
-858,790 | -21.8% | 16 | -1.53% |
| The Clift | 786 | 1,960,000
21 Oct 2011 |
1,350,000
15 Feb 2023 |
-610,000 | -31.1% | 12 | -3.06% |
| OUE Twin Peaks | 1,055 | 3,057,820
14 Oct 2010 |
2,450,000
24 Feb 2023 |
-607,820 | -19.9% | 13 | -1.69% |
| Marina Bay Suites | 1.604 | 3,403,000
29 Dec 2009 |
2,810,000
1 Feb 2023 |
-593,000 | -17.4% | 14 | -1.36% |
| CityVista Residences | 2,809 | 6,200,000
22 Oct 2018 |
5,750,000
15 Feb 2023 |
-450,000 | -7.3% | 5 | -1.50% |
| Marina One Residences | 1,205 | 2,910,000
23 Dec 2019 |
2,500,000
22 Feb 2023 |
-410,000 | -14.1% | 4 | -3.73% |
| The Sail @ Marina Bay | 689 | 1,930,000
21 May 2012 |
1,560,000
6 Feb 2023 |
-370,000 | -19.2% | 11 | -1.92% |
| Pollen & Bleu | 1,162 | 2,248,250
18 May 2017 |
1,890,000
13 Feb 2023 |
-358,250 | -15.9% | 6 | -2.85% |
| Martin Modern | 1,012 | 3,246,000
16 Dec 2018 |
2,906,800
15 Feb 2023 |
-339,200 | -10.4% | 5 | -2.18% |
| The Sail @ Marina Bay | 893 | 1,786,000
10 Dec 2013 |
1,450,000
17 Feb 2023 |
-336,000 | -18.8% | 10 | -2.06% |
| Reflections At Keppel Bay | 1,625 | 3,615,300
7 May 2007 |
3,280,000
20 Feb 2023 |
-335,300 | -9.3% | 16 | -0.61% |
| The Sail @ Marina Bay | 689 | 1,760,000
2 Jun 2010 |
1,468,888
10 Feb 2023 |
-291,112 | -16.5% | 13 | -1.38% |
| OUE Twin Peaks | 570 | 1,540,000
23 Apr 2018 |
1,255,000
14 Feb 2023 |
-285,000 | -18.5% | 5 | -4.01% |
| 111 Emerald Hill | 1,970 | 4,779,281
4 Oct 2012 |
4,500,000
27 Feb 2023 |
-279,281 | -5.8% | 11 | -0.55% |
| 111 Emerald Hill | 2,120 | 4,772,250
8 Jul 2013 |
4,525,000
15 Feb 2023 |
-247,250 | -5.2% | 10 | -0.53% |
| OUE Twin Peaks | 549 | 1,443,800
18 Jan 2017 |
1,200,000
22 Feb 2023 |
-243,800 | -16.9% | 6 | -3.04% |
| Marina Bay Suites | 1,571 | 3,285,000
21 Dec 2009 |
3,100,000
21 Feb 2023 |
-185,000 | -5.6% | 14 | -0.41% |
| Vida | 527 | 1,260,000
28 Dec 2012 |
1,080,000
16 Feb 2023 |
-180,000 | -14.3% | 11 | -1.39% |
| Lumiere | 915 | 1,732,500
9 Feb 2010 |
1,594,000
17 Feb 2023 |
-138,500 | -8% | 13 | -0.64% |
| Stellar RV | 926 | 1,611,700
17 Sep 2012 |
1,505,000
27 Feb 2023 |
-106,700 | -6.6% | 11 | -0.62% |
| The Clift | 506 | 1,108,140
4 Jul 2011 |
1,028,000
14 Feb 2023 |
-80,140 | -7.2% | 12 | -0.62% |
| Prestige Heights | 345 | 660,000
12 Jul 2013 |
605,000
9 Feb 2023 |
-55,000 | -8.3% | 10 | -0.87% |
| SilverSea | 1,066 | 1,924,000
29 May 2012 |
1,880,000
24 Feb 2023 |
-44,000 | -2.3% | 11 | -0.21% |
| Urban Lofts | 754 | 952,000
5 May 2011 |
911,000
7 Feb 2023 |
-41,000 | -4.3% | 12 | -0.37% |
| The Rise @ Oxley – Residences | 818 | 1,871,396
14 Oct 2016 |
1,838,000
27 Feb 2023 |
-33,396 | -1.8% | 7 | -0.26% |
| Duo Residences | 1,001 | 2,256,000
11 Dec 2013 |
2,225,000
28 Feb 2023 |
-31,000 | -1.4% | 10 | -0.14% |
| Waterscape at Cavenagh | 1,184 | 2,244,000
19 Mar 2010 |
2,218,000
10 Feb 2023 |
-26,000 | -1.2% | 13 | -0.09% |
| Nine Residences | 710 | 931,000
18 Aug 2014 |
905,000
10 Feb 2023 |
-26,000 | -2.8% | 9 | -0. |
| Reflections At Keppel Bay | 893 | 1,500,000
22 Mar 2012 |
1,480,000
24 Feb 2023 |
-20,000 | -1.3% | 11 | -0.12% |
| The Interweave | 409 | 720,800
31 Oct 2014 |
708,000
22 Feb 2023 |
-12,800 | -1.8% | 9 | -0.20% |
| Loft @ Nathan | 377 | 785,700
19 Oct 2010 |
775,000
2 Feb 2023 |
-10,700 | -1.4% | 13 | -0.11% |
| Sun Plaza | 1,357 | 960,000
21 Aug 2012 |
950,000
21 Feb 2023 |
-10,000 | -1% | 11 | -0.1% |
| Reflections At Keppel Bay | 1,012 | 1,744,200
27 Apr 2010 |
1,740,000
23 Feb 2023 |
-4,200 | -0.2% | 13 | -0.02% |
| Loft @ Nathan | 1,022 | 1,449,591
14 May 2013 |
1,448,800
27 Feb 2023 |
-791 | -0.1% | 10 | -0.005% |

92.3% of the loss-making units were bought during a property boom
A common trend we observed was that most of the units (36) were bought when prices were sky-high. This is one likely reason why the owners still suffered capital losses despite selling the properties during a peak.

When we filtered them down by their holding periods, 30 of them (76.9%) were held for at least 10 years. All were bought during a robust property market, except a unit from Marina Collection and two units from Marina Bay Suites, which were bought when prices were down in 2008 to 2009.
76.9% of the loss-making transactions came from the CCR
Interestingly, among these 39 loss-making units, a majority of them (30 units or 76.9%) came from the Core Central Region (CCR).
The Rest of Central Region (RCR) recorded seven condo losses, while only two units from Outside Central Region (OCR) were sold at a loss.

As mentioned in the 99-SRX Flash Report for February 2023, prices of resale condos in the CCR have dropped in the month, albeit marginally by 0.3%. This may explain the relatively high number of condo losses coming from the CCR.
Meanwhile, when compared by market segments, those in the OCR have seen the highest price growth at 2.3%. This is followed by resale condos in the RCR, which clocked a price increase of 1.4%.
According to Wong Siew Ying, Head of Research and Content at PropNex Realty, one possible explanation is that prices at new launches, such as Terra Hill in the RCR and Sceneca Residence in the OCR, may have influenced resale prices in these market segments.
Condos for sale
64.1% of the loss-making units were from upper floors
Another trend we noticed was that more than half (25 out of 39) of the loss-making units had come from the upper floors, from the 10th storey to the 40th storey.
Considering that upper-floor units tend to be in higher demand and command higher prices, it’s interesting that a handful of them were sold at a loss.
A likely explanation is that owners from the upper-floor units may have held their units longer, hoping for the right time to sell their properties when the price is right. In fact, among these 25 upper-floor units, 18 were held for at least 10 years.
On the other hand, some owners of lower-floor units may have sold their units earlier to cut their losses.
Planning to cut your losses and sell your property? Let us help you get the right price by connecting you with a premier property agent.
If you found this article helpful, 99.co recommends 4 units at Reflections at Keppel Bay made a loss in January 2023, the biggest at S$1m and Top condo gainers that are sub-sales from Jan to Mar 2023.
The post 39 condo units sold at a loss in February 2023, the biggest at S$2.68m appeared first on .


