View of luxury apartments in Singapore.
By David Dickinson
Where are the most tenants and owner-occupiers to be found in condominium and apartment projects across Singapore? This is fairly easy to answer because information on all registered residential leases is freely available online from the Urban Redevelopment Authority (URA)*. As most landlords register their leases it’s a good indicator of rental activity.
Over 2018 there were about 80,600 residential leases registered across some 293,000 private non-landed properties (average Q1 to Q3 2018) which meant there were 27.5 new leases for every 100 properties. Lets call this the “Lease Ratio” and we can use it to compare the extent of leasing across projects.
It’s a useful but not perfect measure for making comparisons. For example, if leases are one year in length then there will be one registered every year (ignoring time finding new tenants and early terminations), but if leases are two years in length then there will one registered every two years. So if two projects of the same size have the same number of leases registered every year they probably won’t have the same proportion of apartments rented. Also, in new projects we might see many leases in the first year after completion but much fewer in the second year as units are initially rented. We also know from rental ads on PropertyGuru that small apartments are more likely to be advertised on shorter leases than large apartments. Also, projects with small numbers of units have more fluctuations in leases from year to year than larger projects.
To come up with the 10 most rented and owner-occupied projects, I excluded those completed after 2014 because they may not have been fully stabilised or all sold, and also used the average annual number of leases from 2015 to 2018 to help smooth fluctuations at the project level. Projects with less than 100 units were excluded as were those in single ownership for rental-only. I also excluded projects that were offered or sold enbloc for redevelopment.
Most rented projects
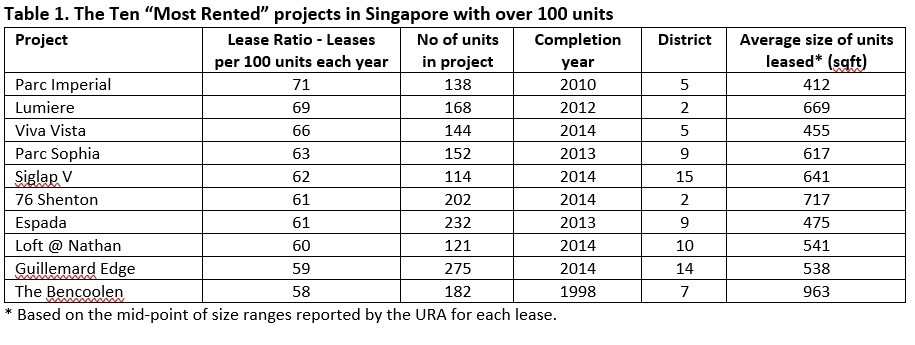
The award for the project with the highest Lease Ratio goes to Parc Imperial in Pasir Panjang with 71 leases per 100 units, followed by Lumiere near Tanjong Pagar with 71 (see Table 1).

Most of the top 10 are recent projects though Parc Imperial is not so new and The Bencoolen is relatively old. Amongst the newer projects it’s possible that some developers have leased unsold apartments and the average unit sizes in the top 10 are small. In comparison, the average size of all units leased in Singapore was about 1,200 sq ft.

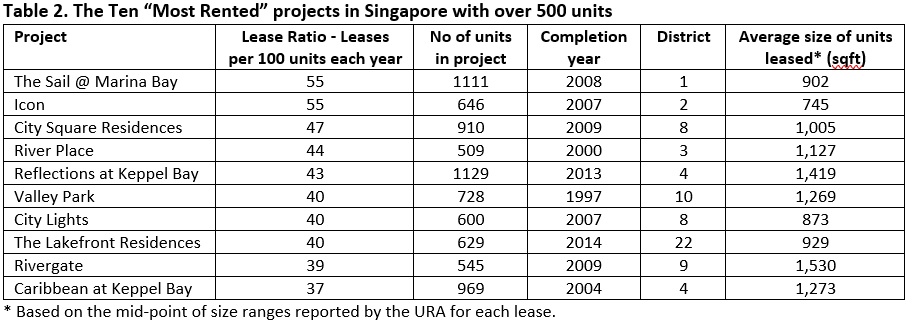
Turning to projects with over 500 units (Table 2) The Sail @ Marina Bay and Icon in the CBD take the title of most rented each with 55 leases per 100 units. Keppel land’s Reflections and Caribbean at Keppel Bay both make the top 10. The top 10 projects are mostly centrally located, though The Lakefront Residences in seventh place is a surprise as it is in the Jurong area. These larger projects tend to be older and leases are for larger units than seen in smaller developments with the highest lease ratios.
Looking for a rental property in Singapore? Find an agent to take the hassle out of your home search.
Most owner-occupied projects
Where is the most owner-occupied project? That award goes to Forest Hill Condominium in District 26 with only four leases per 100 units every year. This was followed by Hilltop Grove in the Bukit Batok area of District 23 with six leases. These ratios suggest that the proportion of rented units in these projects is very low. For example, if all the leases in Forest Hill were two years duration, then the maximum percentage leased for the development would be eight percent, though in reality it’s probably less due to some leases being shorter.

Rio Vista comes in seventh overall with seven leases but tops our list for projects with over 500 units shown in Table 4.

Aside from the projects, what might we generalise from these league tables.
Firstly, centrally located developments seem to contain more leases and therefore rental apartments, while those in outer districts contain fewer.
Higher rates of leasing is evident in newer projects, probably in those under 500 units in size. As a rule of thumb older projects may have lower Lease Ratios and are more decentralised, though there are exceptions such as Valley Park that is very central. Also smaller projects are more likely to have higher leasing ratios though this might be because inner districts could contain projects that are smaller than in outer districts, on average.
In the next piece I look more closely at these observations and whether they are reasonable. Till next time.
*The URA provides information on every registered lease including project name, month of lease, monthly rent, unit size range and number of bedrooms. Unfortunately the length of each lease is not provided.
Check out PropertyGuru’s properties for rent! Alternately, refer to our other handy rental guides, or read more about the hottest areas to live in with PropertyGuru’s AreaInsider


